Read about the development process of The Carbon Map, a carbon emission calculator for more sustainable city planning.
Avoin, Natural Resources Institute Finland, and Finnish Environment Institute have joined forces and produced The Carbon Map, a carbon emission calculator, which helps experts calculate how zoning affects the carbon stock of the built environment. The tool was published on the 23rd of January, 2024, and you can access it here.
We interviewed the team that developed The Carbon Map in the fall of 2023. This article is a summary of these interviews and aims to shed light on what it is like to develop a digital tool in cooperation with many different organizations.
The first phase of the project: goal clarification
As a digital tool, The Carbon Map is the first of its kind, which is why its development started by narrowing down what features future users need from it. For this purpose, Avoin’s user experience designer Lara Jasim interviewed municipal decision-makers, planners, and experts from Natural Resources Institute Finland and Finnish Environment Institute. According to Jasim, considering different stakeholders’ perspectives on the tool’s design is vital, if one wants good results. Feedback from future users has been collected regularly throughout the whole development process of The Carbon Map.
“For many, The Carbon Map represents a new kind of approach to zoning planning,” says Jasim. “During the development, it has been important to consider the tools and methods already in use, so that we can introduce features to The Map that are already familiar to users. For example, the drawing feature has been a much-needed feature for many users.”
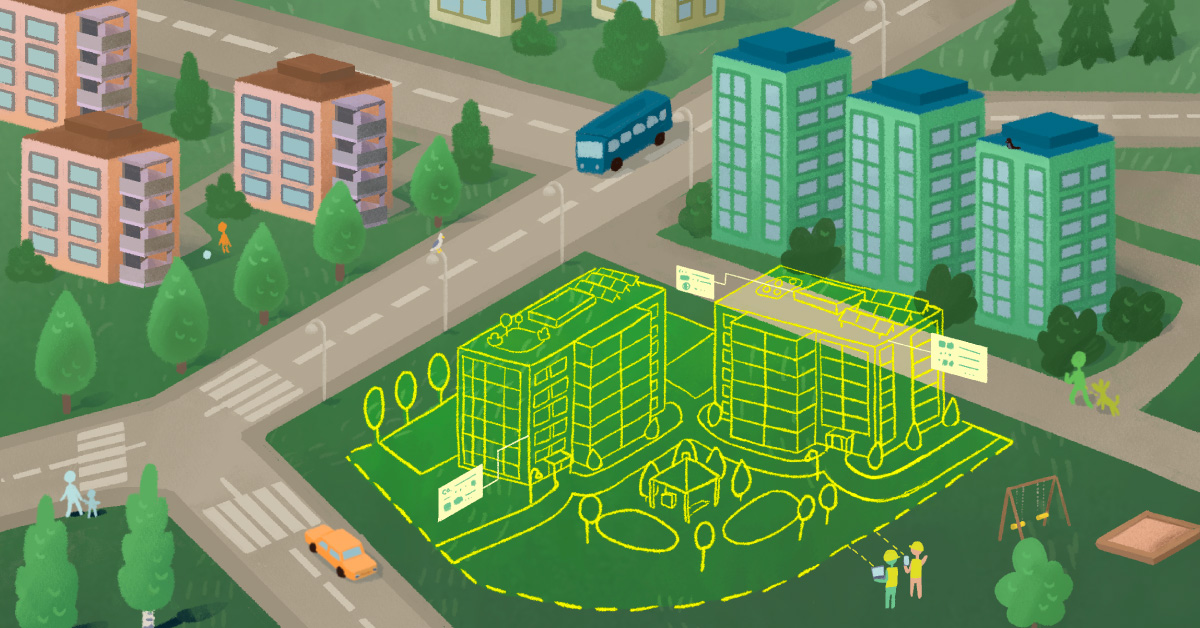
As a result of the interviews and development meetings, it became clear the solution needed to be a geospatial data-based tool that would be simple enough to use. The tool would need to allow the planner to import or draw area boundaries, which would be the basis for environmental carbon stock calculations. In addition to mere numerical values, the tool would need to produce an understandable summary of the calculation process. This means the results The Map produces would need to both clearly present the scientific sources and contain sufficiently broad justification for the calculations.
Building a puzzle
After the basic idea of The Carbon Map had been outlined, it was time to build the data bank for the tool. Antti Rehunen, Senior Research Scientist at Finnish Environment Institute, says: “The Carbon Map brings together sources such as soil information about peatlands (from Geological Survey of Finland), materials from Natural Resources Institute Finland, as well as some data from Finnish Environment Institute, such as data from green yard areas. The data collected for The Map is indeed one of the important results of the project.” Kari Oinonen, Group Manager of Urban Development at Finnish Environment Institute, sees making The Carbon Map as building a kind of puzzle: “When all areas can be found on the map, the puzzle is ready. When this is reality, the development of the entire Finnish carbon storage can be monitored.”
In addition to the data bank, calculation methods useful for data analysis have had to be compiled for The Map. Research Scientist in greenhouse gas inventory at Natural Resources Institute Finland, Jukka-Pekka Myllykangas, says: “The Carbon Map project is exceptionally extensive when one thinks about how many different calculations we are trying to include in one tool. It has been challenging, but interesting to work on a project like this in cooperation with experts from many different organizations”.
Erno Mäkinen, spatial data expert at the zoning department of the city of Tampere, has been involved in the project as a user. He thinks it´s important that the tool’s documentation is handled well from the beginning of the development process. “If there is no proper documentation of the source material, we at the city of Tampere cannot use the tool, because we do not currently have a deep enough understanding of the background information,” he states. “It is also important that the results presented by the tool are comparable with the results of other tools used in zoning. We need compatibility especially with tools based on YKR (Yhdyskuntarakenteen seurantajärjestelmä, a spatial data-based monitoring system developed by The Ministry of the Environment’s Administrative Branch).” In the development of the tool, attention has been paid to compatibility at the international level, as the map attempts to utilize the calculation logic used in international greenhouse gas inventory whenever possible.
Final result: A digital tool for calculating the climate effects of zoning
When it comes to the climate effects of land use, one of the big challenges in Finland and the world is that forests are being reduced to buildings and farmland. The prevention of deforestation is therefore an essential goal for the land use sector, which The Carbon Map aims to support. Sanna Andersson, Senior Ministerial Advisor at the Ministry of the Environment, believes that The Carbon Map will concretely promote the consideration of the climate perspective in land use. “With the help of The Carbon Map, city planners can evaluate the effect their plan has on local carbon storage, both in general zoning, as well as in clean energy projects. The Ministry of the Environment has seen a need for this kind of tool, especially from the point of view of municipal zoning and ELY centres (Centres for Economic Development, Transport and the Environment),” she summarizes.
More and more municipalities are interested in planning their zoning with environmental issues in mind. Sampo Pihlainen, Senior Research Scientist at the Finnish Environment Institute, who has acted as an advisor on the carbon storage calculation in the project, states: “Municipalities hope for their emission calculations to include information about the carbon storage of soil, forests, and fields. The Carbon Map is useful for this goal, as well.”
Jaakko Nippala, Ministerial adviser at Ministry of Agriculture and Forestry, says: “At the beginning of the project the goals were ambitious, and we have tried to meet them throughout the project. Within the framework of this project, we certainly won’t be able to solve the entire deforestation due to zoning problem, but the tool is nevertheless a significant investment in more sustainable land use planning.”
“Our goal in Tampere is to minimize the harmful climate effects of the general zoning plan,” says Erno Mäkinen. “I am sure that The completed Carbon Map will be widely useful for this.”
Read more about the tool here.
The Carbon Map project is part of the research and innovation programme Catch the Carbon launched by the Ministry of Agriculture and Forestry in the spring of 2020. The programme aims to reduce greenhouse gas emissions in land use and strengthen the Finnish carbon storage. Read more about the programme here.